Inventory and projects
View as MarkdownTree view
Section titled “Tree view”Inventario (Inventory) lists the enrolled servers and everything they contain, following the contains relationship: a Proxmox node contains its CTs and VMs, a Docker or Podman host contains its containers. Each row shows the type, the address, the state and the vulnerabilities: the highest open severity and how many CRITICAL and HIGH findings already have a fix.
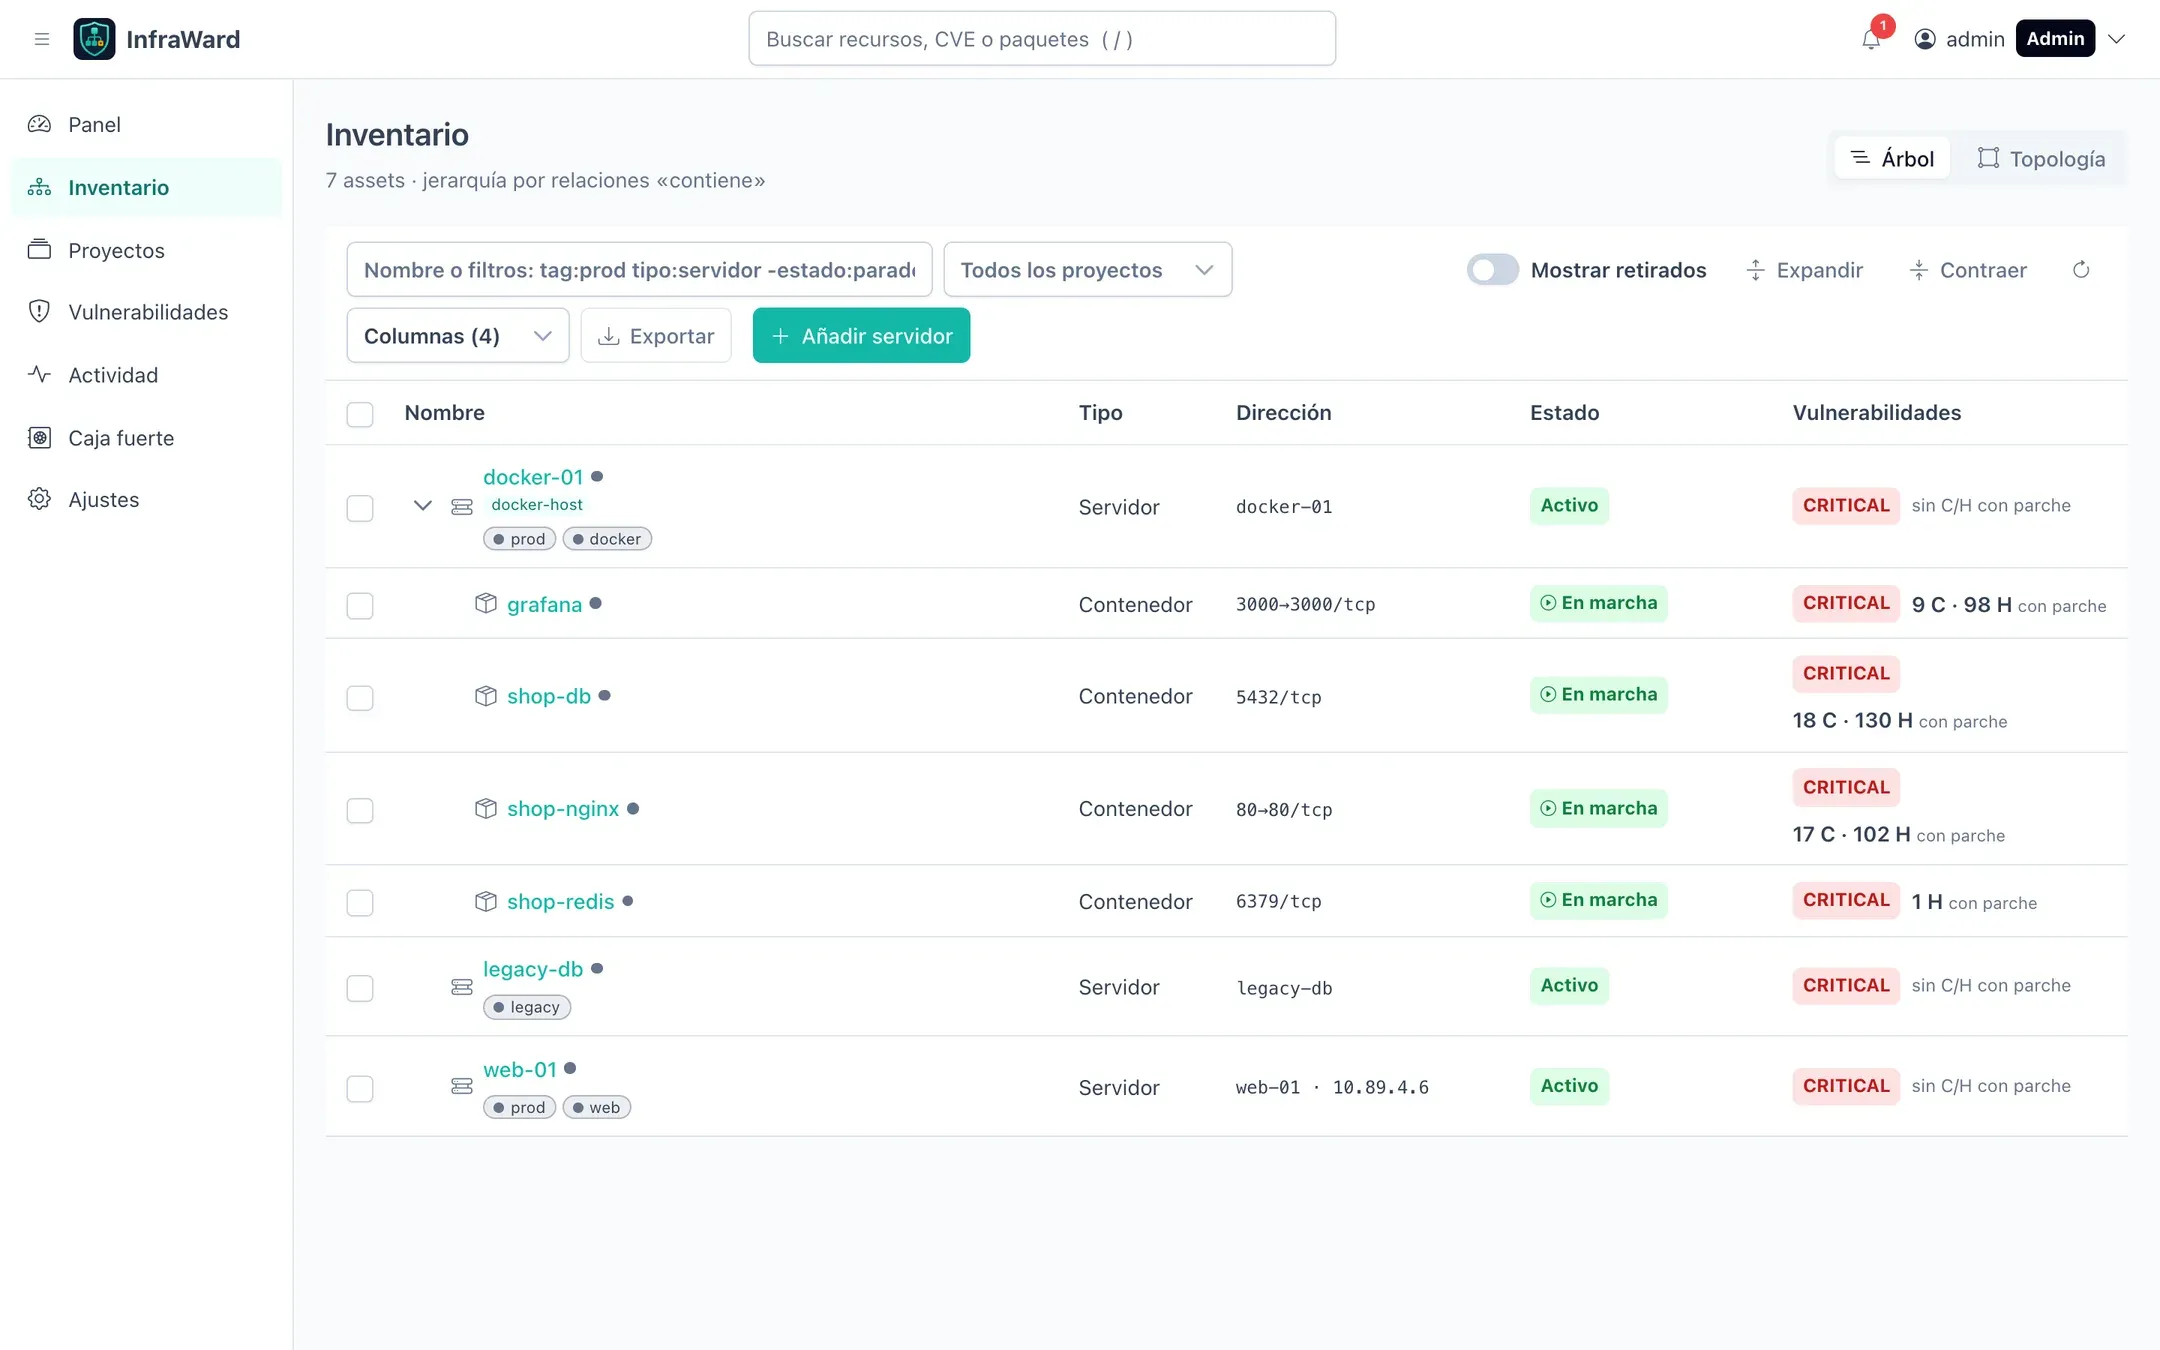
From the toolbar you can show retired assets, expand or collapse every branch, choose the visible columns and export the current view to CSV or JSON.
Search syntax
Section titled “Search syntax”The search box accepts free text and filters. Free text only matches names.
tag:prod tipo:contenedor -estado:parado ip:10.0.0.0/24| Key | Matches |
|---|---|
tag: |
A tag, exact match. |
nombre: / name: |
Part of the visible or discovered name. |
tipo: / type: |
Asset type: servidor, ct, vm, contenedor, imagen… |
estado: / status: |
Inventory or runtime state: activo, retirado, parado… |
rol: / role: |
A detected role, such as docker-host or podman-host. |
proyecto: / project: |
A project, by name or ID. |
ip: |
An exact address, a prefix (10.0.) or an IPv4 network (10.0.0.0/24). |
Rules: quote values with spaces (nombre:"web prod"), prefix a term with - to negate it, repeat a key for OR (tag:prod tag:staging) and combine different keys for AND. The query is stored in the URL, so you can share a filtered view by copying the address.
Topology view
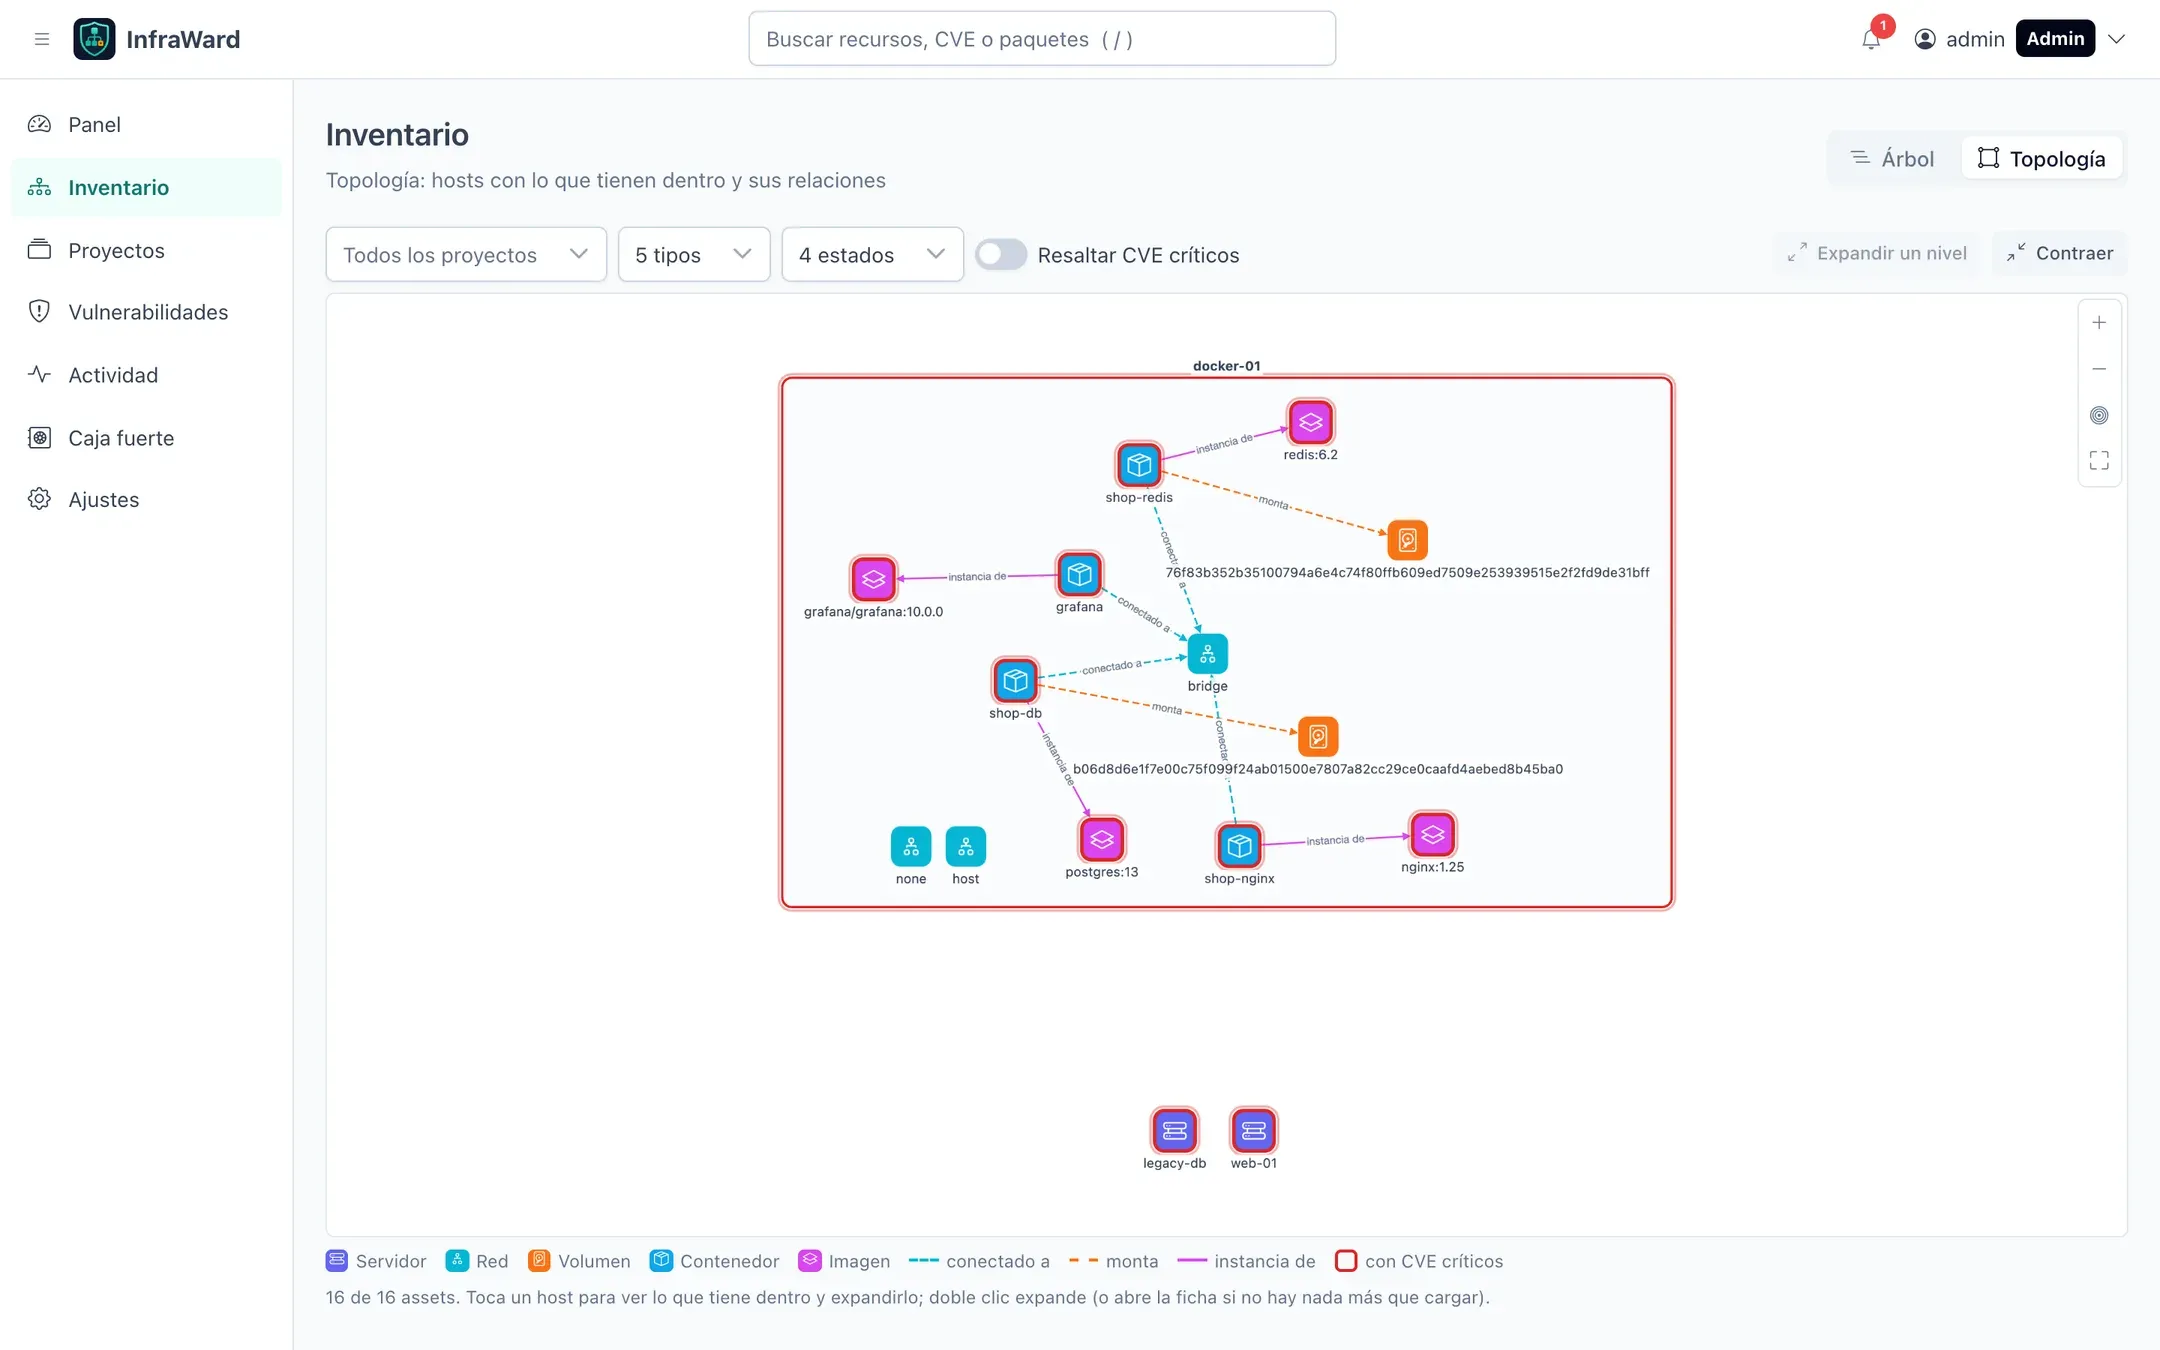
Section titled “Topology view”Topología (Topology) draws hosts and what they contain as a graph: containers, images, networks and volumes, with connected to, mounts and instance of links. Click a host to load its contents, double-click to expand it, and use Resaltar CVE críticos (Highlight critical CVEs) to outline assets with critical vulnerabilities.
Asset page
Section titled “Asset page”Each asset has its own page with tabs: Resumen (Summary), Vulnerabilidades, Paquetes (Packages), Servicios (Services), Puertos (Ports), Relaciones (Relations: map, hierarchy and list), Credenciales (Credentials from the vault), Recolecciones (Runs), Snapshots and Datos en bruto (Raw data).
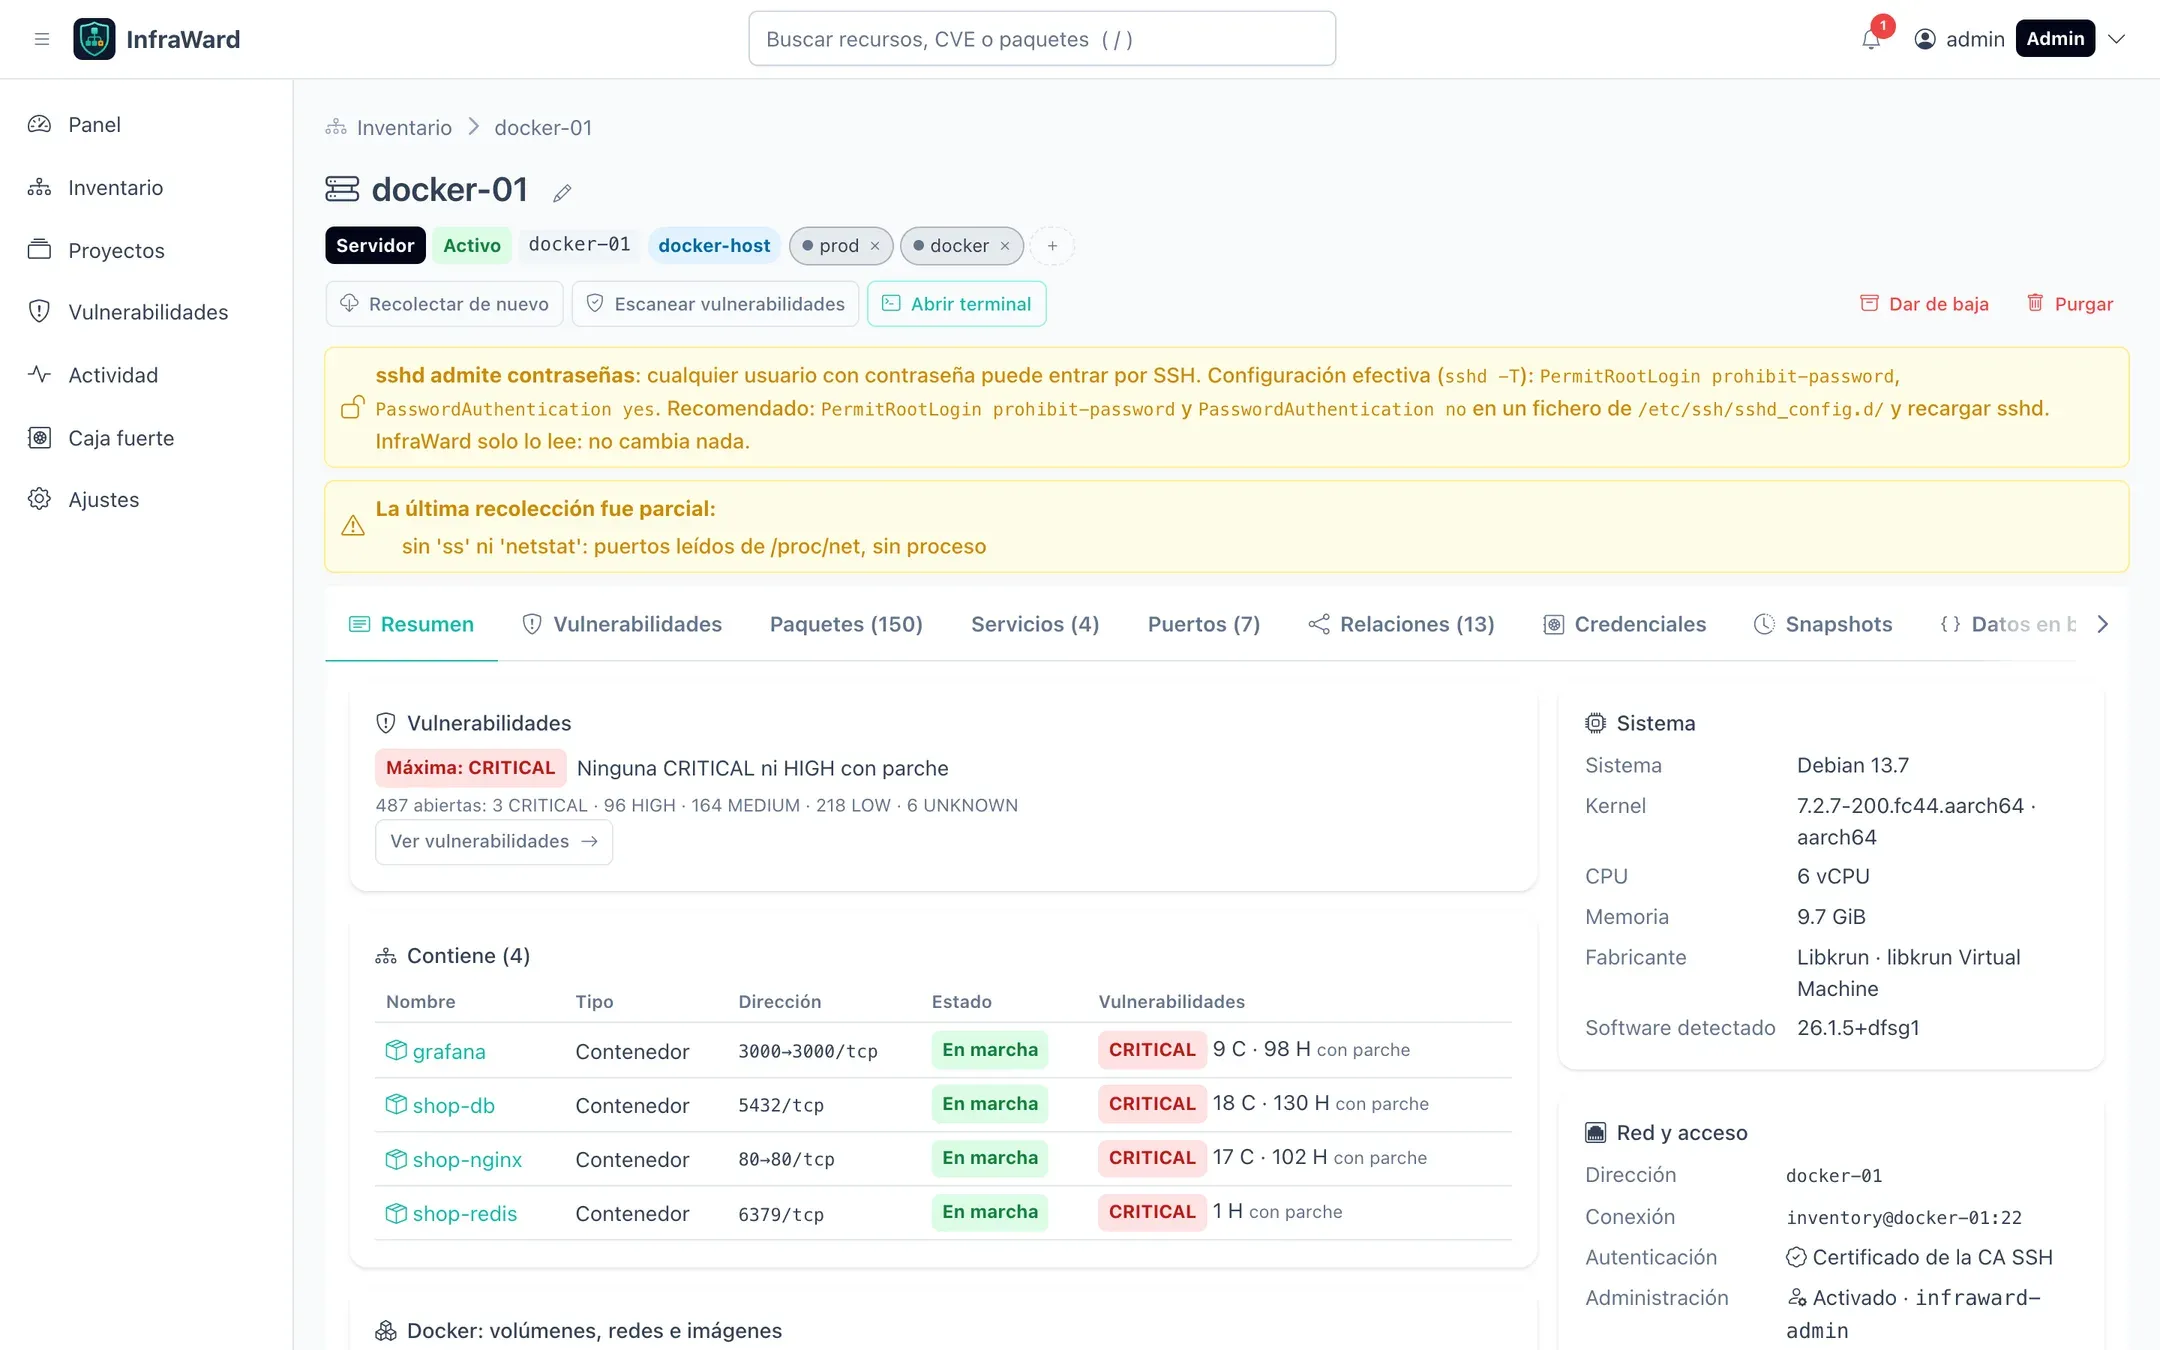
The summary also shows warnings found during collection, for example when sshd accepts passwords or when the last collection was partial. On a host with rootless Podman it also shows the Usuarios de Podman card (see Podman).
Actions on the page depend on your role and the asset: Recolectar de nuevo (Collect again), Escanear vulnerabilidades (Scan), Abrir terminal, Reconciliar ahora (Reconcile now), notes, tags, an asset-specific policy, Dar de baja (Retire) and Purgar (Purge).
Run logs
Section titled “Run logs”Recolecciones (Runs) lists the asset’s collections, discoveries and scans with their date, type, state and duration. Failed runs are highlighted. Select one to see its log:
- the steps of the run and every command the worker ran (
ssh,ansible-playbook,trivy…) with its duration and exit code; - the Ansible tasks, behind Ver detalle (Show detail), and the failed ones with their message;
- the last lines of the error output of whatever failed, and the result.
The log refreshes while the run is queued or running. Secrets, keys and tokens are redacted before the log is saved, and command output (the server data) is never stored. Each run’s log is capped at 256 KiB (COLLECTION_LOG_MAX_KB) and deleted after 30 days (COLLECTION_LOG_RETENTION_DAYS).
Everyone can see the list of runs. Reading a log requires the assets.operate permission (Admin, Editor and Operator), because it includes error output from the servers.
Snapshots
Section titled “Snapshots”Every collection that changes something stores a snapshot. Snapshots lists them and shows the differences between two of them: packages added, removed or upgraded, services, ports and system data.
Bulk actions
Section titled “Bulk actions”Tick the rows you want (or Seleccionar todo lo visible, Select all visible) and use the bar at the bottom: tag and untag, move to a project, collect, scan, apply a policy or retire. The available actions depend on your role. Selecting a host does not select its children.
Tags are free text. Add them from the asset page or in bulk. Their colours are set in Ajustes → Inventario. Tags drive policies (reconciliation and scanning per tag) and terminal access.
Projects
Section titled “Projects”A project groups assets, each with everything it contains. Adding a Docker host adds its containers, images, networks and volumes. Exceptions take an asset and its contents out of the project.
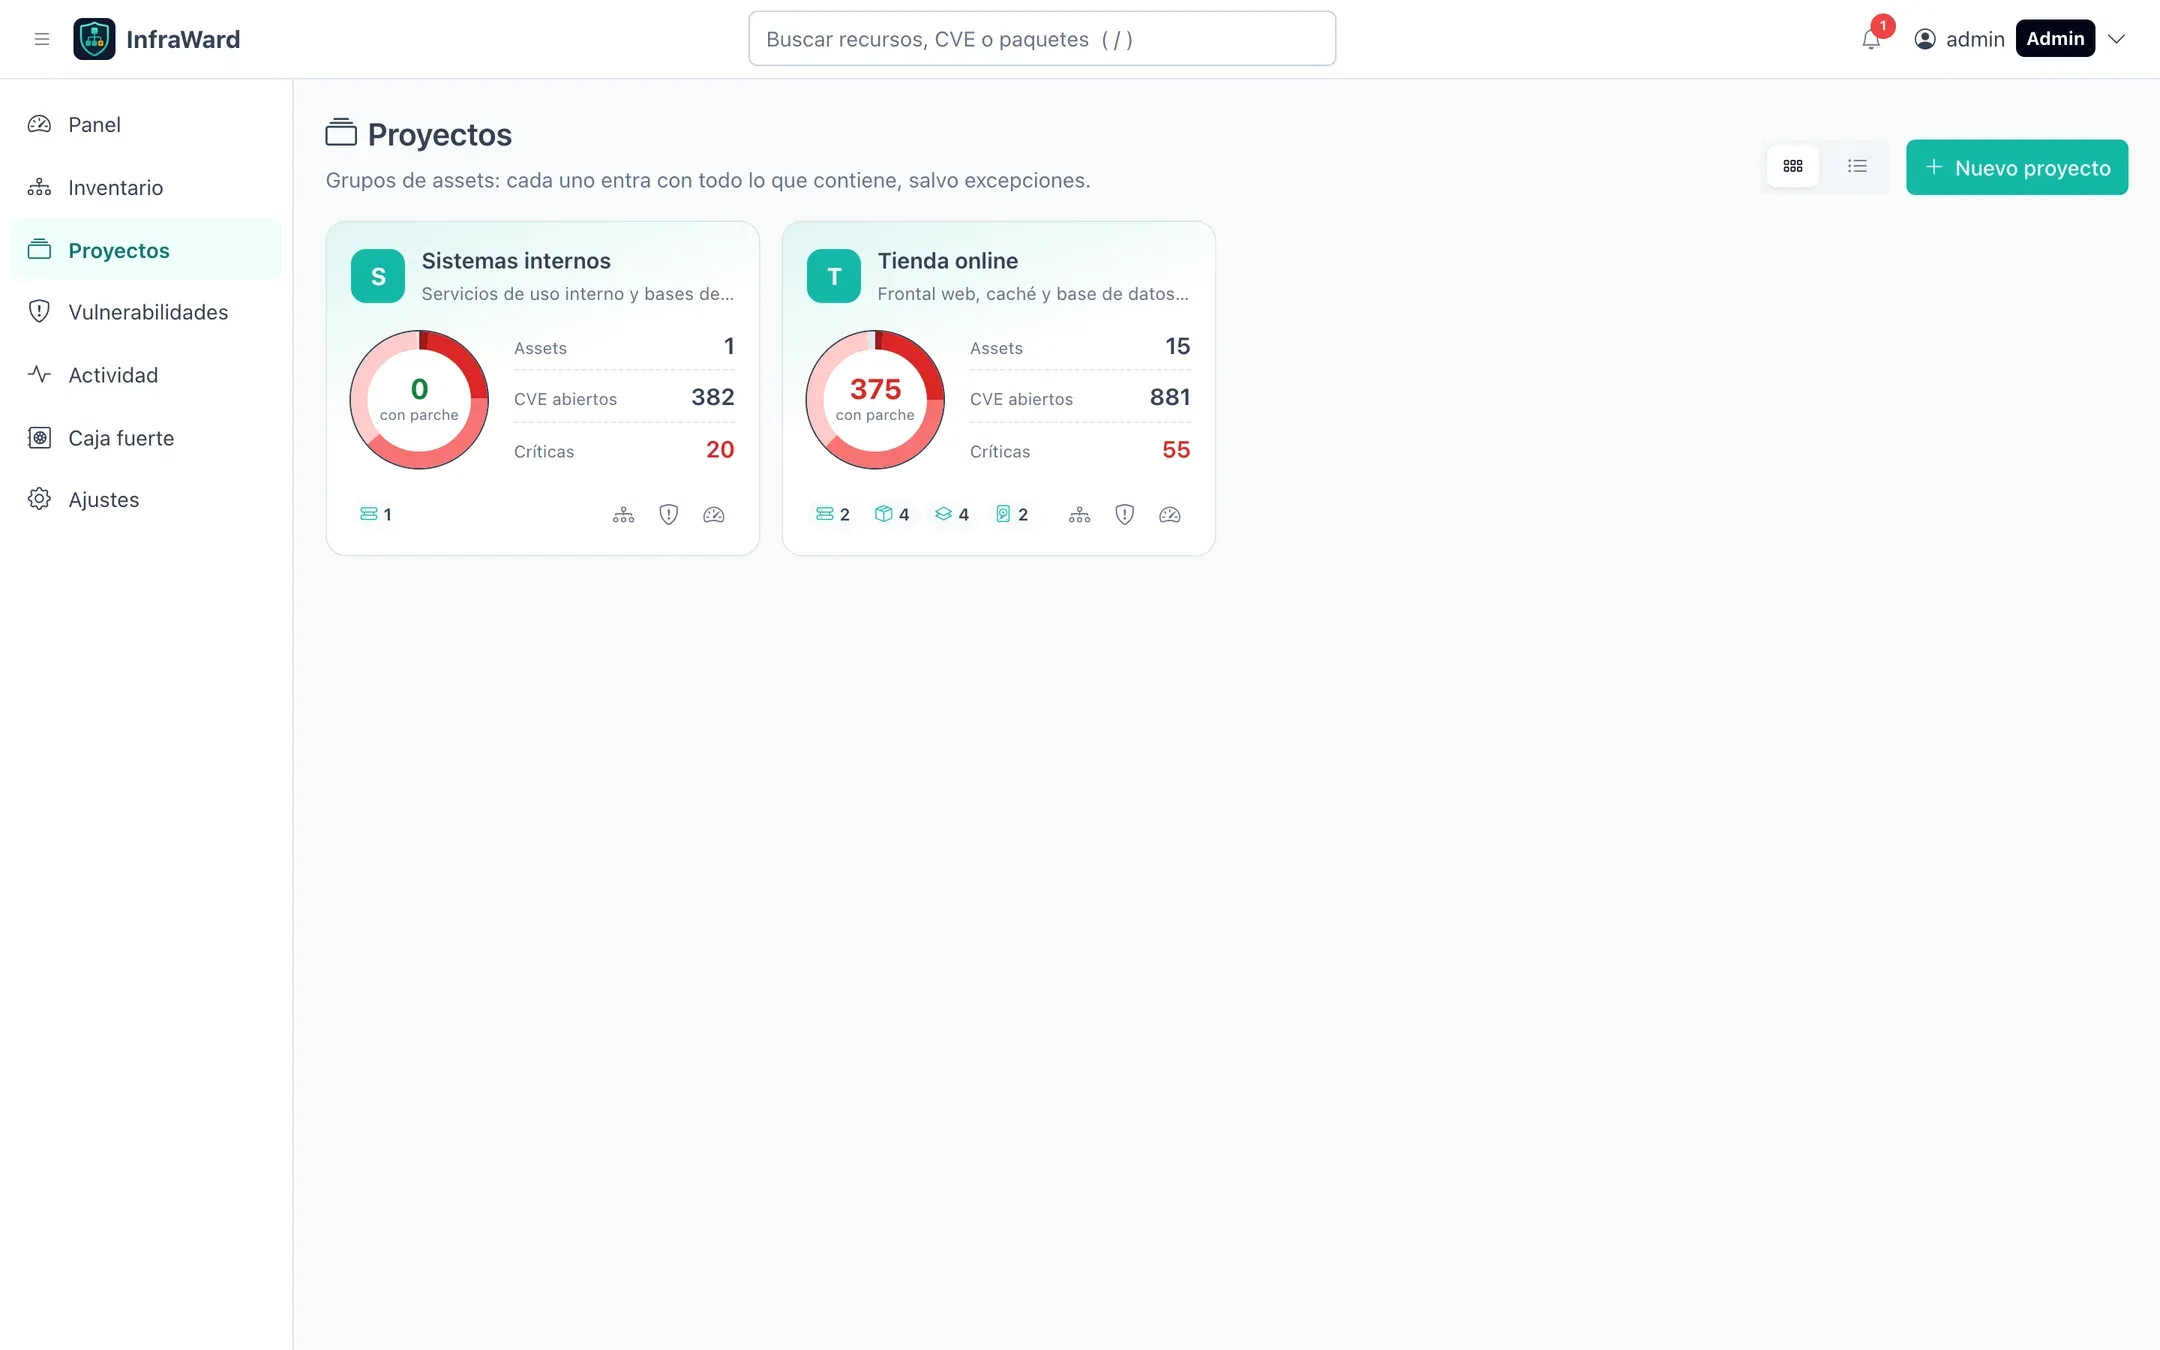
Each project has its own dashboard, its own policy (applied unless the asset, a parent or a tag has a more specific rule) and can be used as a filter everywhere (proyecto:).
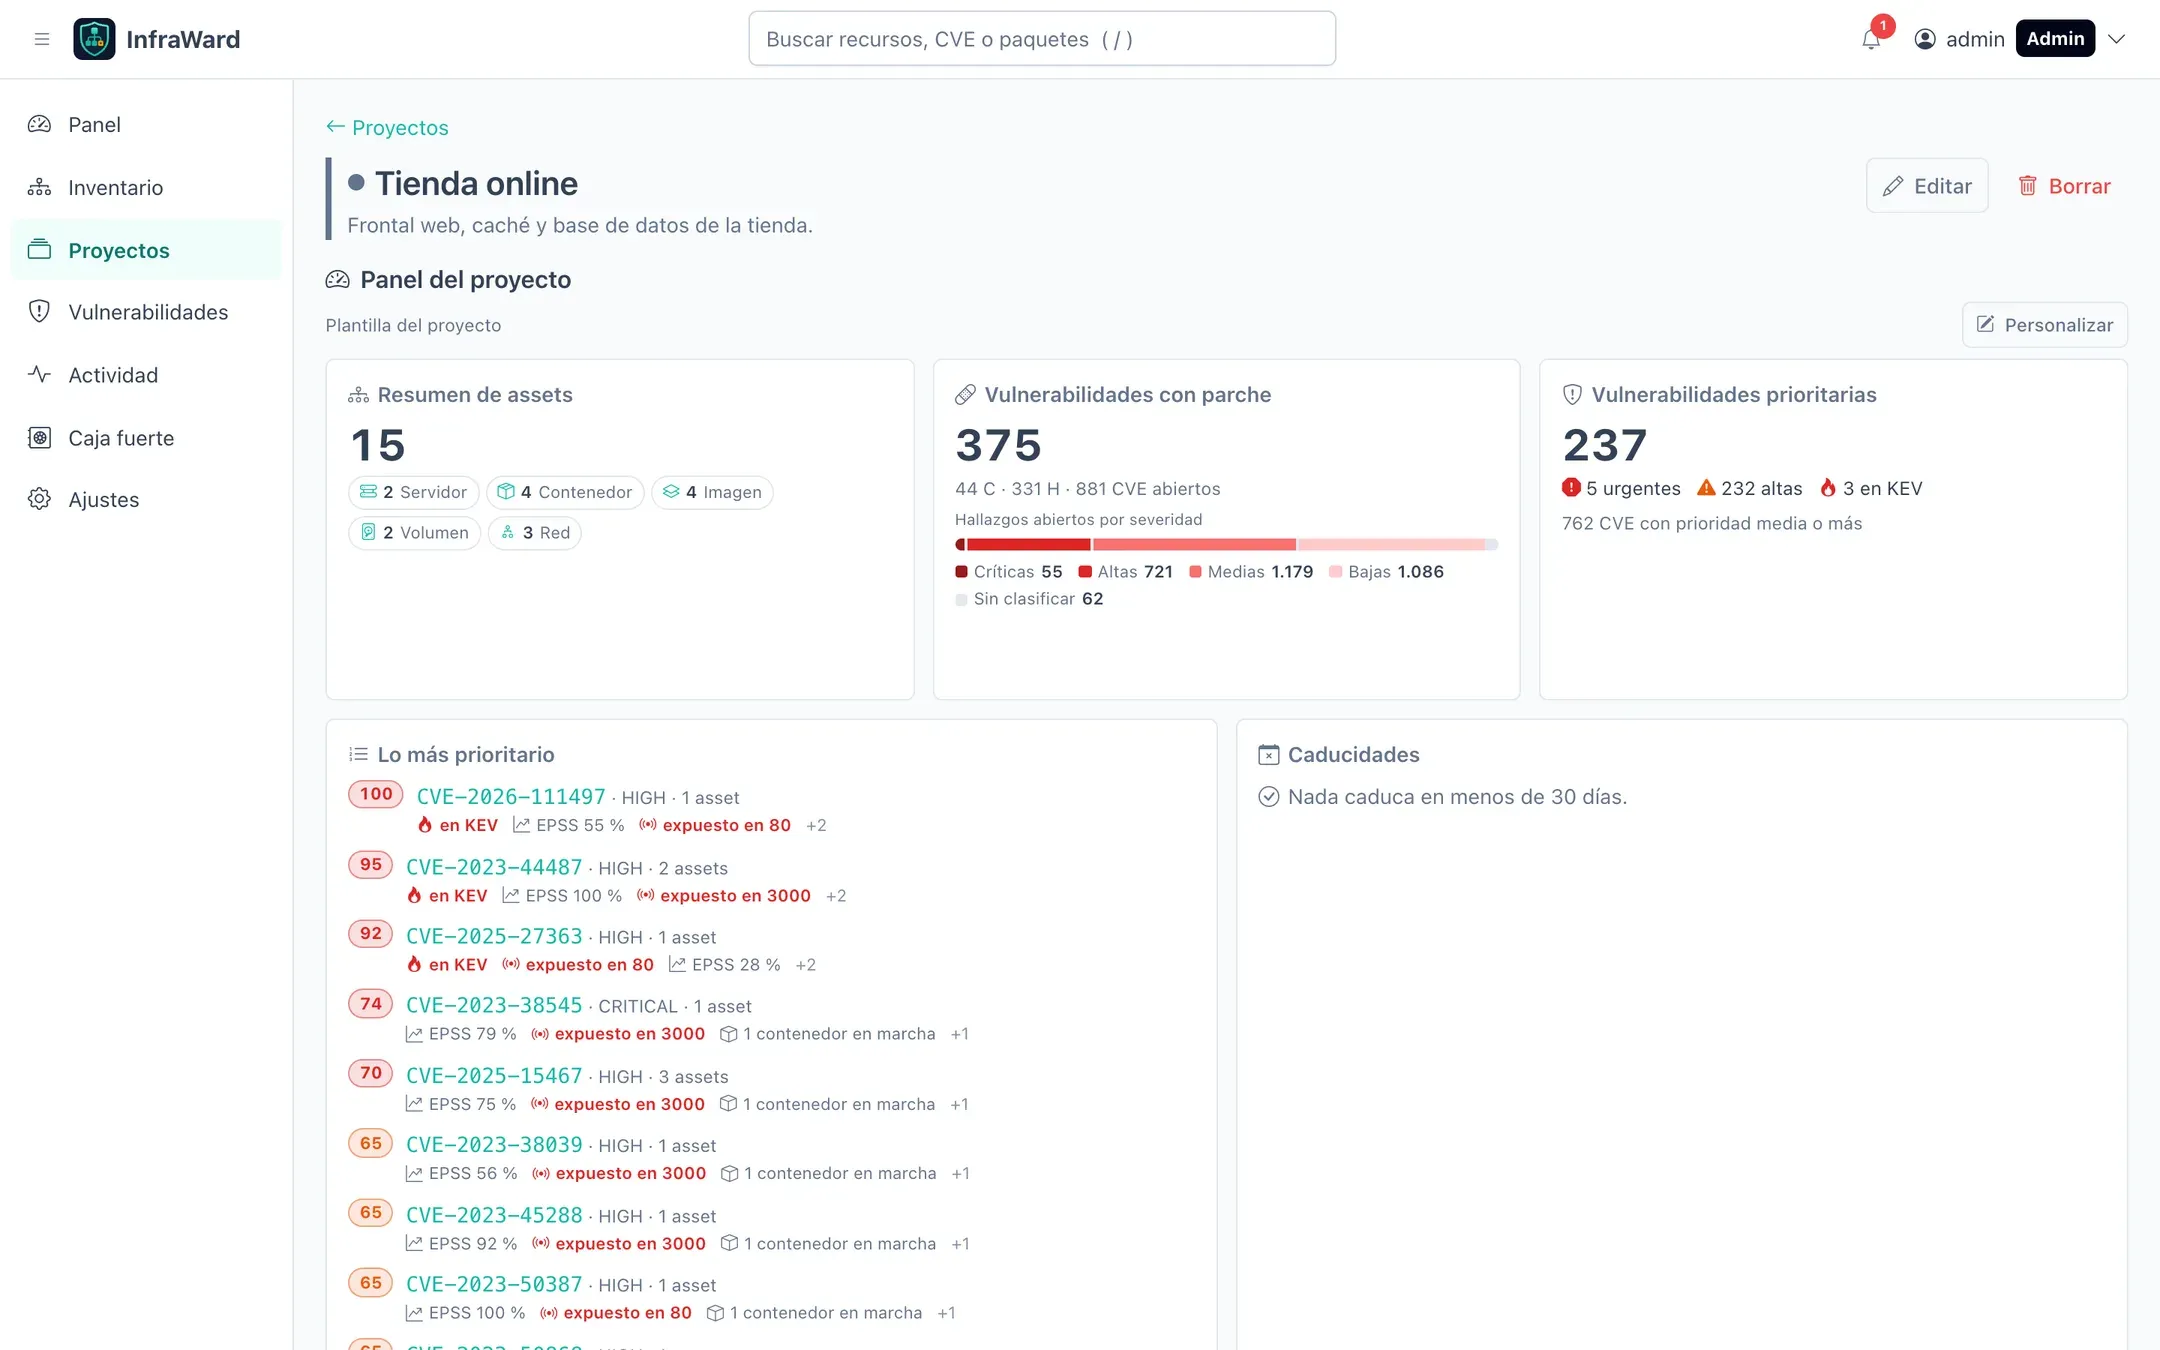
Dashboards
Section titled “Dashboards”Panel (Dashboard) is a grid of widgets: prioritised vulnerabilities, pending enrolments, running jobs, assets by type or state, warnings, expiries, new CVEs, recent activity and trend charts. Select Personalizar (Customise) to add, remove, resize and move widgets. Each user has their own layout, and each project has its own.
Reconciliation
Section titled “Reconciliation”The worker reconciles each root node on the interval set by its policy (every 6 hours by default). It collects and rediscovers the node, adds new items, updates changed ones and keeps a snapshot. An item missing from 3 consecutive full discoveries (RECONCILE_RETIRE_AFTER) is marked as retired. Reconciliar ahora forces it for one asset.
Activity
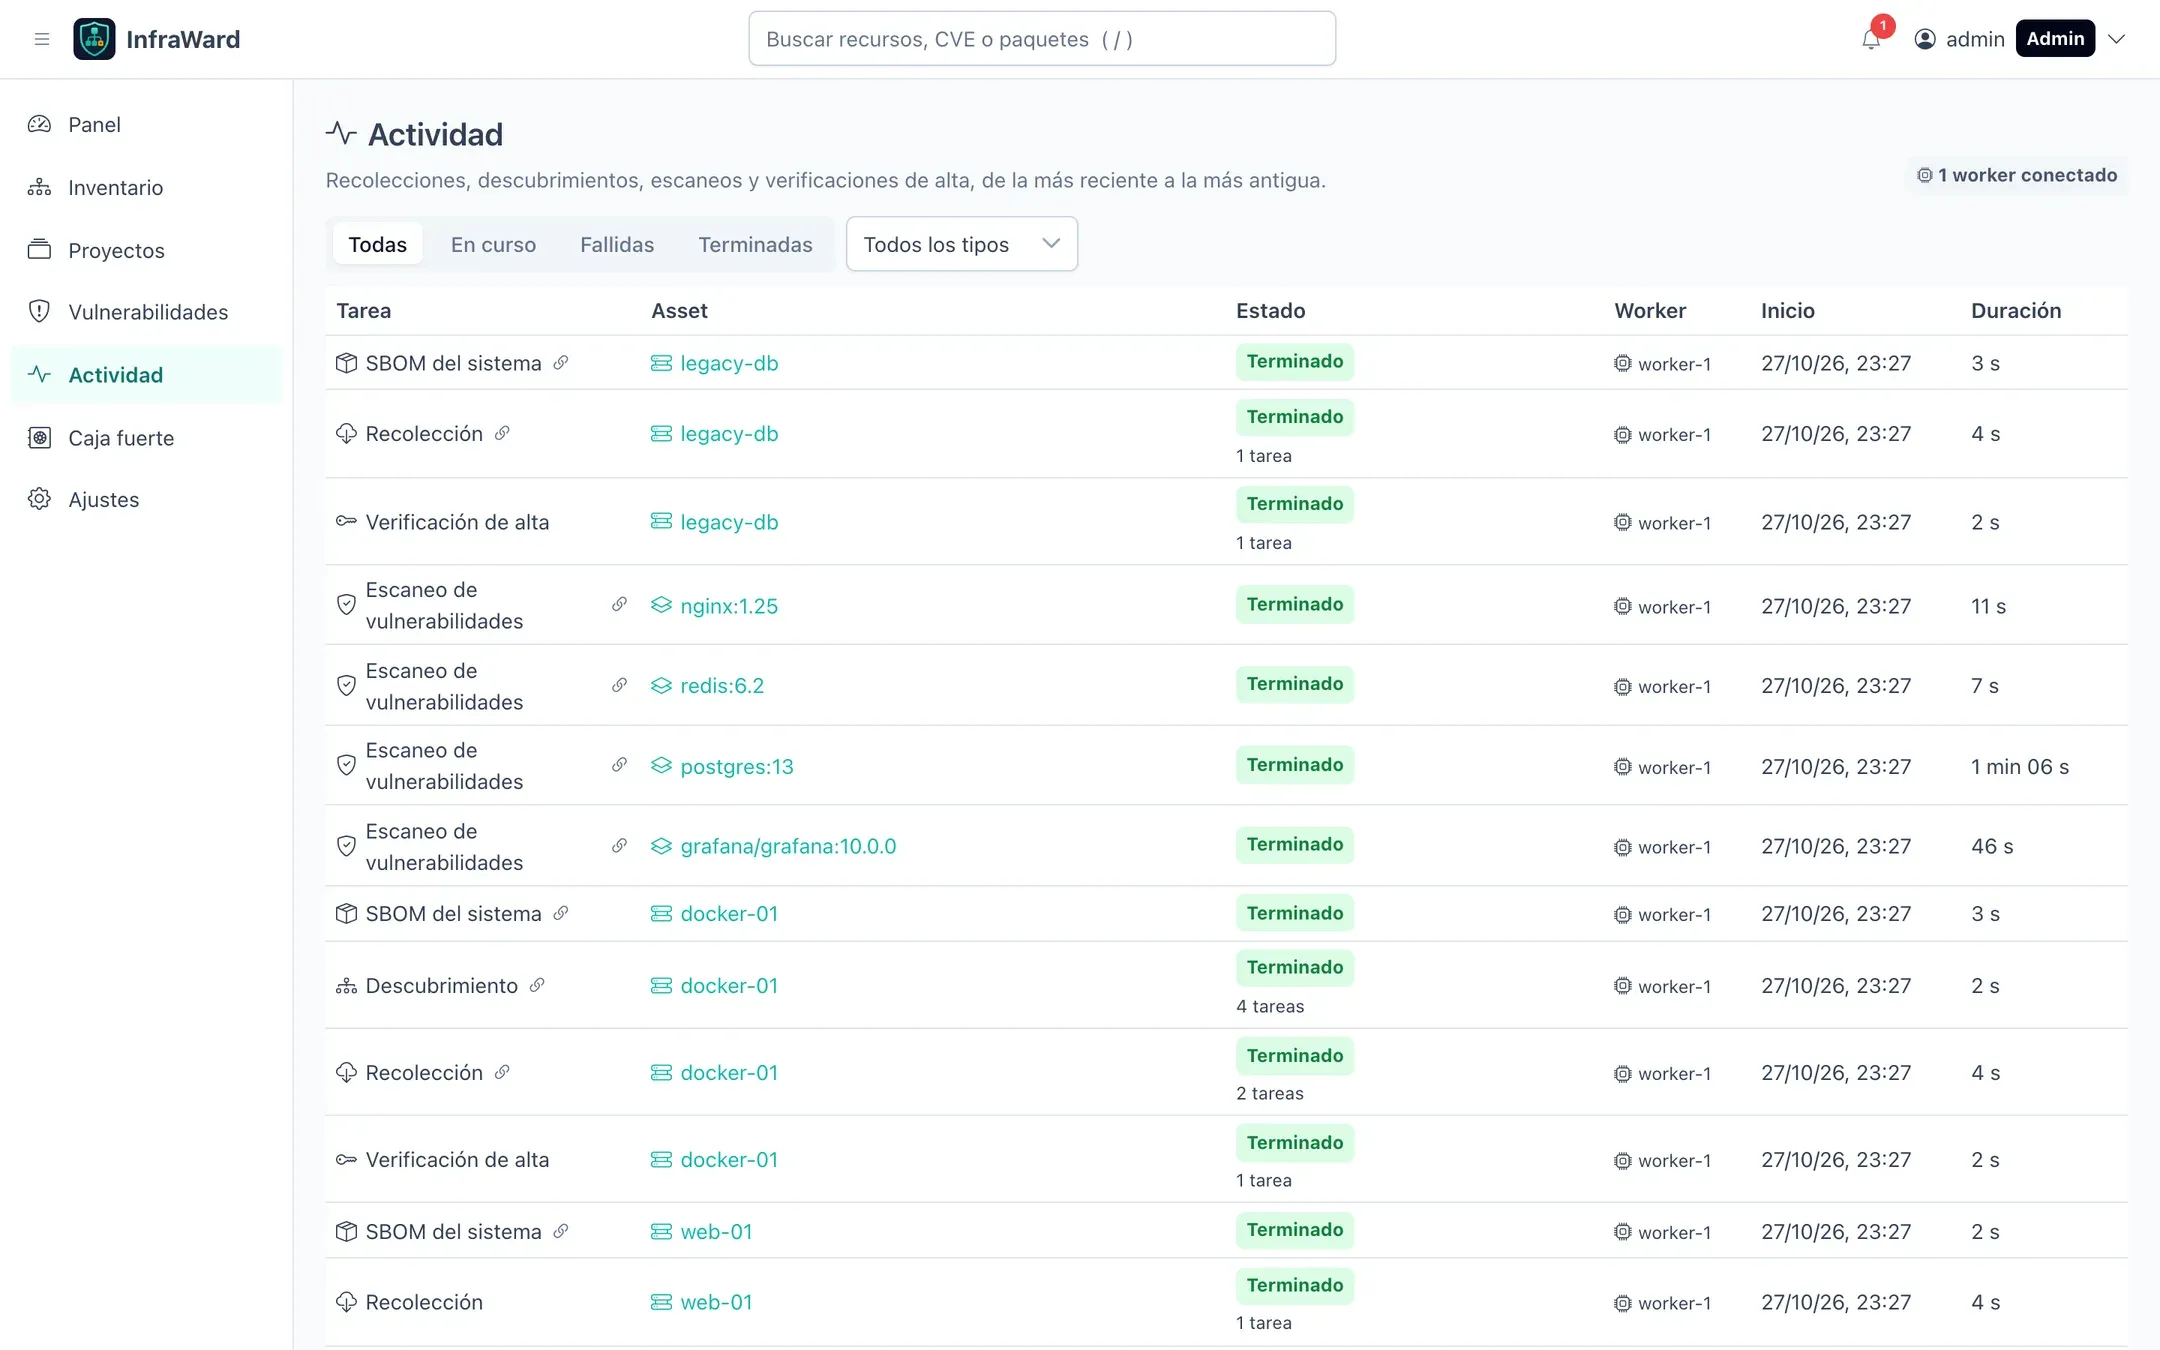
Section titled “Activity”Actividad (Activity) lists every job (collections, discoveries, scans, enrolment checks, SBOM re-evaluations) with its asset, state, worker replica, start time, duration and whether it has a log.
Each job shows its origin, with a link to whatever launched it:
| Origin | Meaning |
|---|---|
| En lote (Bulk) | A bulk action on several assets. |
| Encadenada (Chained) | Another job, for example a collection that started a discovery. |
| Manual | Someone asked for it from the interface or the API. |
| Programada (Scheduled) | The periodic inventory check (reconciliation). |
| Alta (Enrolment) | The verification of a new server. |
Filter by state, type or origin to find failed jobs and their error. Selecting a row opens the job’s own page (/activity/<id>) with its timing, the error, the jobs it launched and its log (with assets.operate). The Recolecciones tab, the Actividad reciente (Recent activity) widget and the result of a bulk action link to it. Jobs recorded before version 0.6.0 show no origin.